By Classification
By Year
By Region
By Department
Other
Distribution of Observation Cases by Type, Dynamic Statistics
Category
Definition
Percentage
A
Perfectly identified phenomenon
24.56 %
B
Probably identified phenomenon
39.71 %
C
Unidentified phenomenon (lack of data)
32.43 %
D
Unidentified phenomenon (after investigation)
2.30 %
D1
Unidentified phenomenon (after investigation), of Medium consistency
0.99 %
D2
Unidentified phenomenon (after investigation), consistency Strong
0.00 %

Since 2016 the GEIPAN uses "dynamic" statistics. They are calculated with the data related to classified cases that are published on the website all years combined. 

24.6%
39.7%
3037 Cas - Statistics of 04/01/2024

Since 2016 the GEIPAN uses "dynamic" statistics. They are calculated with the data related to classified cases that are published on the website all years combined. 

Breakdown by year

This diagram displays and counts published GEIPAN testamonies. Files in progress will only be counted once completed.

Breakdown by region

Region names were not updated to maintain historical continuity in the calculation of case numbers by region.

Breakdown by department
Other diagram

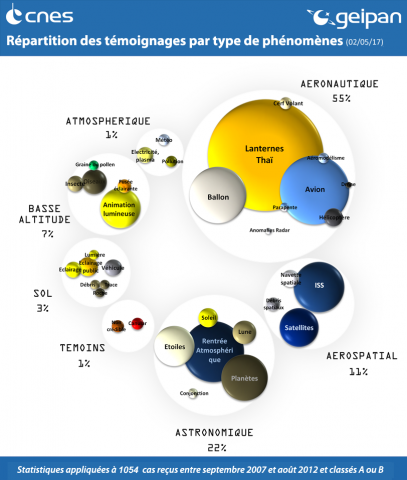
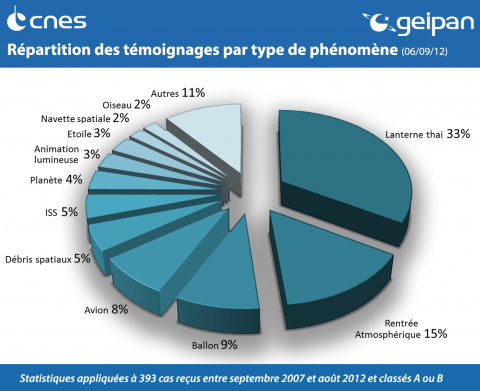
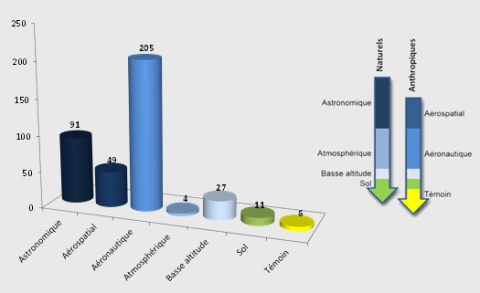
Below are listed the main types of identified phenomena according to their spatial range (from space to the ground) and according to their origin (natural or human). UAP's that are classed as type C or D (D1/D2) correspond to phenomena whose nature is not known and are therefore not included in the statistics below. These statistics correspond to cases received between September 2007 and August 2012.

Image
les principales catégories de phénomènes
Image
les  bulles


Image
histogramme